OK, let's say that I just finished some cool new EEG experiment where I recorded my EEG response to watching cat videos while listening to the Pink Panther at half speed. My next step would be to take a quick look at the data to get the overall big picture. My favorite way of getting that overall view is to make a spectrogram (see example below). My love for these oh-so-colorful plots runs deep. The question is, how does one make spectrograms? Well, in my opinion, if you don't have Matlab (and are afraid of Python), the next best way to make spectrograms is to use one of the multitude of audio editing software packages out there. Many audio edit programs provide a spectrogram view. This post is about getting EEG data into an audio program so that you can see your data.
Converting to a WAV File: The first step in using an audio program for EEG analysis is to convert one's EEG data into an audio file. Since I usually work in Windows, I tend to convert all of my EEG data into WAV files. I choose WAV because it is uncompressed. I never choose MP3 because it is very unclear what its "perceptual coding" would do to my precious brainwave data. So, a WAV file is what I would recommend. But how do you get EEG data into a WAV format? If your EEG data is in text format (such as is logged by the OpenBCI GUI), you could use my Processing sketch "ConvertToWAV". This sketch will read in an OpenBCI log file and write each EEG channel out as its own WAV file. You can get the sketch on my GitHub.
Audacity: Once the data is in WAV format, you can open it in any audio program. A popular (and free!) audio editing program is Audacity. While it is not my favorite audio editing program, it is perfectly sufficient for working with EEG data. After opening your EEG data, the trick is to figure out how to switch the display from waveform to spectrogram. The screen shot below shows how to do it.
Once Audacity is in spectrogram mode, you need to zoom in on the vertical axis in order to see the interesting EEG features, which are usually focused in the lower frequencies. In Audacity, you zoom simply with a click-and-drag on the vertical axis. Then, after manipulating the spectrogram settings under the "Preferences" menu, you can get a spectrogram like the one shown below. While the color scheme hurts the eyes a bit, this spectrogram is good enough to see the same kind of EEG entrainment as seen in my original Matlab plot. Furthermore, the tools in Audacity let you further analyze the EEG data through zooming, filtering, amplifying, and (if you change the file's sample rate to increase the playback speed) you can use Audacity to listen to your own brain waves! Audacity is definitely a useful tool for working with EEG data.
The spectrogram settings that I used are shown in the screen shot below.
Cool Edit Pro: I first started getting into spectrograms in the late 90's because this is when I started working with audio and music on the computer. What got me hooked on spectrograms was a piece of shareware called Cool Edit. It was a stupid name for an otherwise outstanding program. It was so useful that I spent the extra dollars and bought its upgrad -- Cool Edit Pro. Cool Edit Pro has a *great* spectrogram display, as shown below. Unlike Audacity, which requires lots of manipulation of the spectrogram settings to get a useful view, the Cool Edit Pro display always seems just right. Unfortunately, Cool Edit Pro isn't available anymore -- it was bought by Adobe in the early 2000s and became Adobe Audition. Audition is also fine for making spectrograms (I have only used up to Audition 3.0), but it is expensive.
In Cool Edit Pro, the only display parameter that you need to change is the "Resolution" (ie, FFT size). You do that under the "Settings" menu.
Raven Lite: A third option for making spectrograms is a bit more obscure. A bunch of years ago, I came across a program called "Raven Lite", which is produced by the Ornithology Lab (ie, bird science) at Cornell University. The "Lite" version is free. You can download it and immediately use it for spectrograms, though it is crippled in other ways until you email them for a free (non-commercial) key. What I really like about Raven is that, as shown in the screen shot below, its spectrogram controls are right on the main window for easy manipulation. Also, I like its color map options way better than what is available in Audacity. Finally, Raven is one of the few programs that let you see both the spectrogram view and the waveform view at the same time (not shown). It is really nice to have that capability.
 |
| A Spectrogram of EEG data that was Made in Matlab. This shows data from my previous post, where I was watching a movie with two different blink rates. You can see how my brainwaves entrained with the changing blink rate in the movie. |
Converting to a WAV File: The first step in using an audio program for EEG analysis is to convert one's EEG data into an audio file. Since I usually work in Windows, I tend to convert all of my EEG data into WAV files. I choose WAV because it is uncompressed. I never choose MP3 because it is very unclear what its "perceptual coding" would do to my precious brainwave data. So, a WAV file is what I would recommend. But how do you get EEG data into a WAV format? If your EEG data is in text format (such as is logged by the OpenBCI GUI), you could use my Processing sketch "ConvertToWAV". This sketch will read in an OpenBCI log file and write each EEG channel out as its own WAV file. You can get the sketch on my GitHub.
Audacity: Once the data is in WAV format, you can open it in any audio program. A popular (and free!) audio editing program is Audacity. While it is not my favorite audio editing program, it is perfectly sufficient for working with EEG data. After opening your EEG data, the trick is to figure out how to switch the display from waveform to spectrogram. The screen shot below shows how to do it.
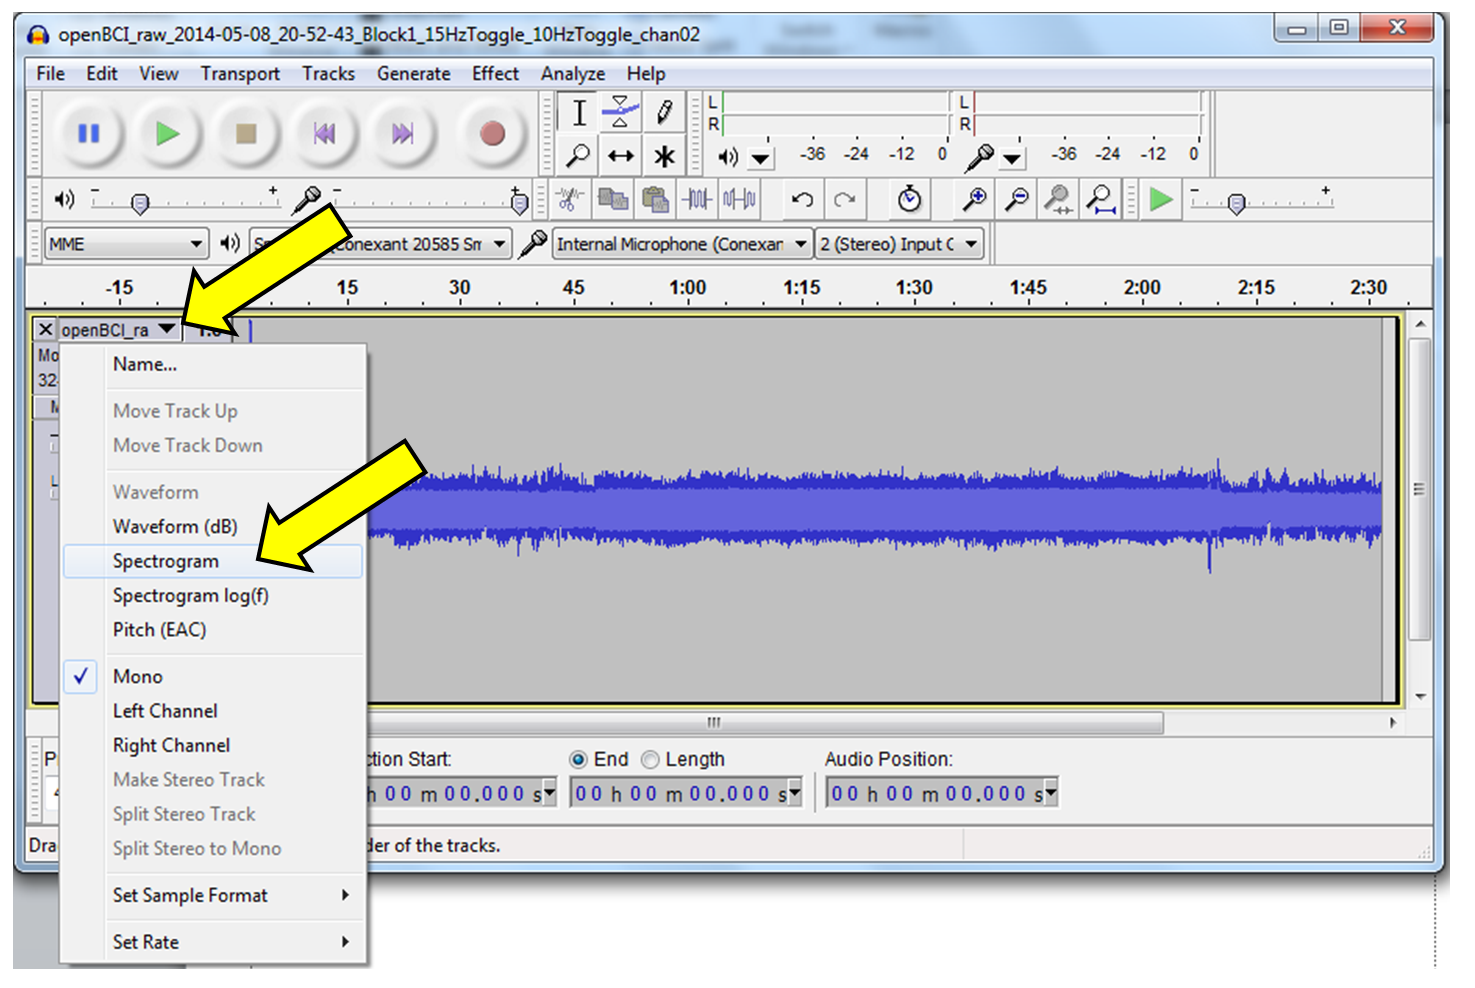 |
| Changing to Spectrogram View in Audacity |
Once Audacity is in spectrogram mode, you need to zoom in on the vertical axis in order to see the interesting EEG features, which are usually focused in the lower frequencies. In Audacity, you zoom simply with a click-and-drag on the vertical axis. Then, after manipulating the spectrogram settings under the "Preferences" menu, you can get a spectrogram like the one shown below. While the color scheme hurts the eyes a bit, this spectrogram is good enough to see the same kind of EEG entrainment as seen in my original Matlab plot. Furthermore, the tools in Audacity let you further analyze the EEG data through zooming, filtering, amplifying, and (if you change the file's sample rate to increase the playback speed) you can use Audacity to listen to your own brain waves! Audacity is definitely a useful tool for working with EEG data.
 |
| In Audacity, a Spectrogram of my EEG Data |
The spectrogram settings that I used are shown in the screen shot below.
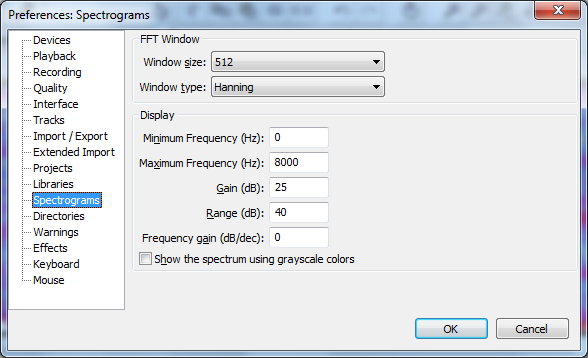 |
| My Display Settings for Making EEG Spectrograms in Audacity. I changed the Window Size, the Gain, and the Range. |
Cool Edit Pro: I first started getting into spectrograms in the late 90's because this is when I started working with audio and music on the computer. What got me hooked on spectrograms was a piece of shareware called Cool Edit. It was a stupid name for an otherwise outstanding program. It was so useful that I spent the extra dollars and bought its upgrad -- Cool Edit Pro. Cool Edit Pro has a *great* spectrogram display, as shown below. Unlike Audacity, which requires lots of manipulation of the spectrogram settings to get a useful view, the Cool Edit Pro display always seems just right. Unfortunately, Cool Edit Pro isn't available anymore -- it was bought by Adobe in the early 2000s and became Adobe Audition. Audition is also fine for making spectrograms (I have only used up to Audition 3.0), but it is expensive.
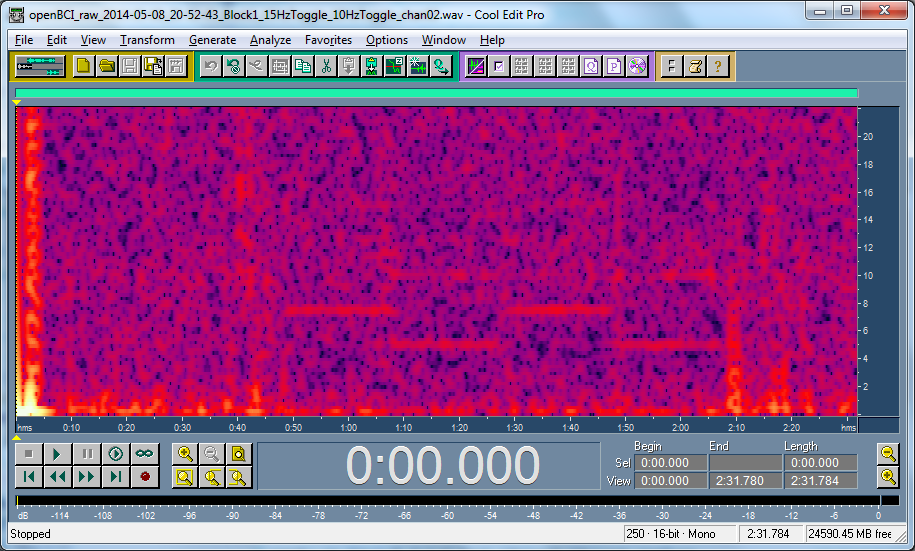 |
| An EEG Spectrogram in Cool Edit Pro V1.2a. It's an old school program that totally rocks. |
In Cool Edit Pro, the only display parameter that you need to change is the "Resolution" (ie, FFT size). You do that under the "Settings" menu.
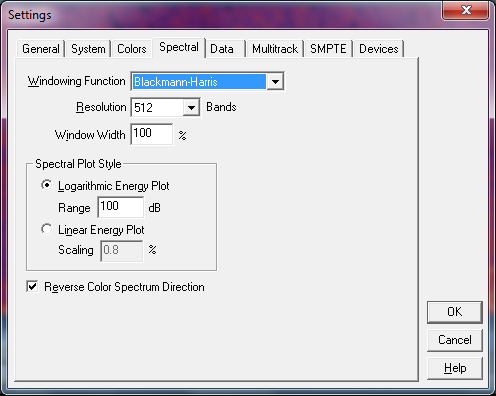 |
| My settings for viewing EEG spectrograms in Cool Edit Pro. I changed the Resolution value. |
Raven Lite: A third option for making spectrograms is a bit more obscure. A bunch of years ago, I came across a program called "Raven Lite", which is produced by the Ornithology Lab (ie, bird science) at Cornell University. The "Lite" version is free. You can download it and immediately use it for spectrograms, though it is crippled in other ways until you email them for a free (non-commercial) key. What I really like about Raven is that, as shown in the screen shot below, its spectrogram controls are right on the main window for easy manipulation. Also, I like its color map options way better than what is available in Audacity. Finally, Raven is one of the few programs that let you see both the spectrogram view and the waveform view at the same time (not shown). It is really nice to have that capability.
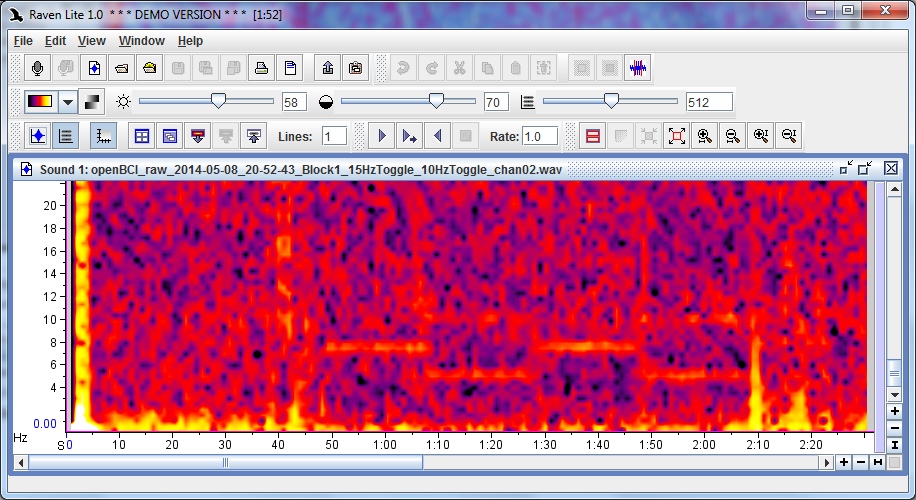 |
| Raven Lite 1.0 from the Cornell Laboratory of Ornithology. It's a pretty good viewer. The settings for the display or right here in the main window. |
Other Options: Because I have Matlab and Cool Edit Pro (and Audacity and Raven) I haven't spent a lot of time looking at other options. Does Garage Band offer a spectrogram view? Is there a plug-in for iTunes or Windows Media Player that gives spectrograms? I'm curious to hear what you folks use. Drop a comment and let me know!